Code
library(ggplot2)
ggplot(data=iris, aes(x = Sepal.Length, y = Sepal.Width)) +
 geom_point(aes(color=Species, shape=Species)) +
 xlab("Sepal Length") +
 ylab("Sepal Width")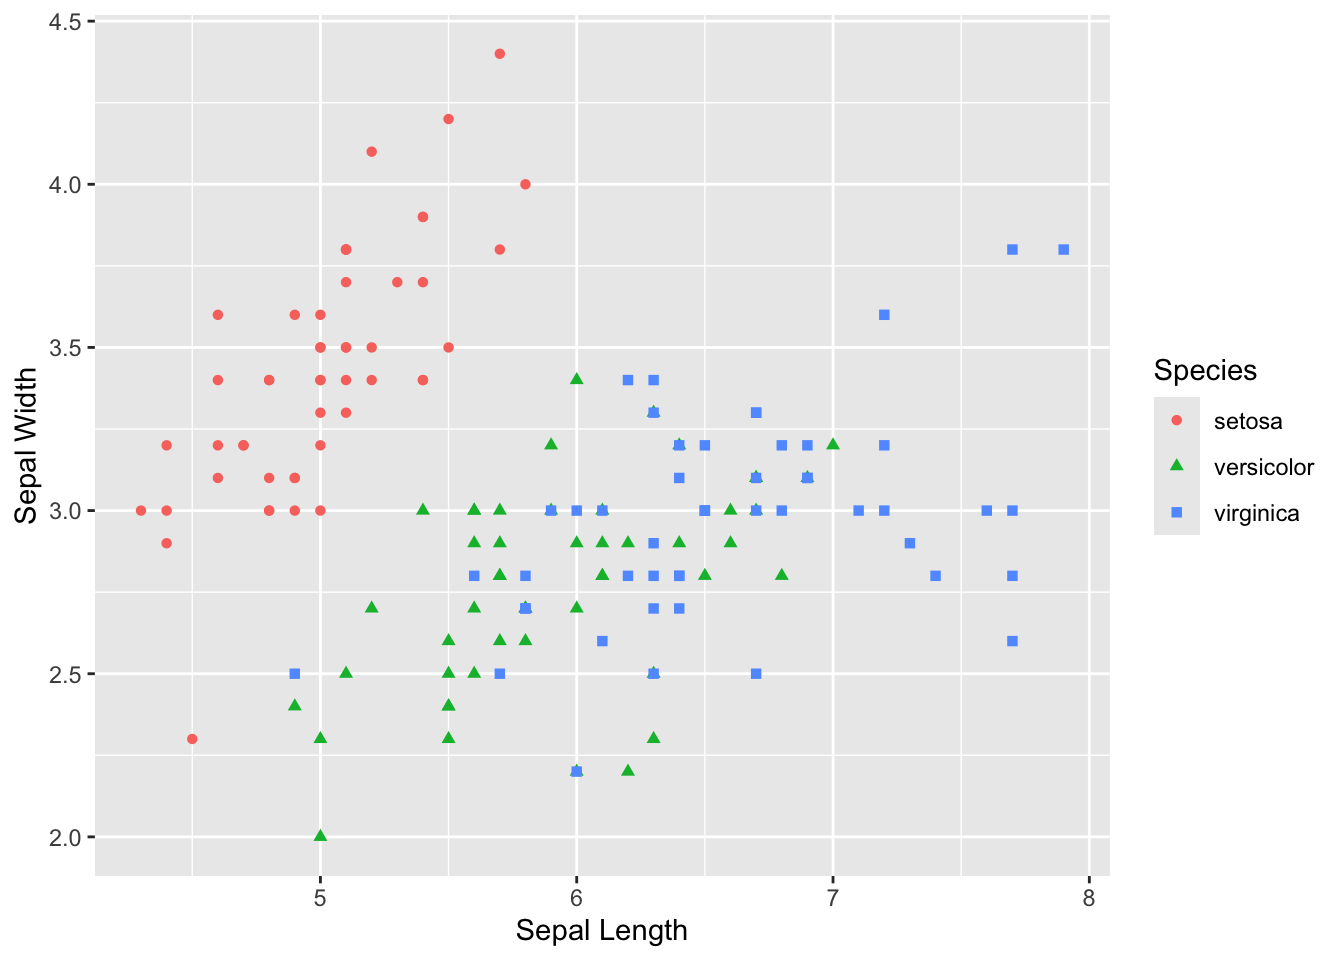
Most of the figures in this book are generated with R. If you are reading this book online, you can view the source code for each figure by clicking the little triangle next to the word “Code” above the figure. In the PDF version of this book the code is listed inline with the figure.
library(ggplot2)
ggplot(data=iris, aes(x = Sepal.Length, y = Sepal.Width)) +
geom_point(aes(color=Species, shape=Species)) +
xlab("Sepal Length") +
ylab("Sepal Width")
These coures notes are made available under the Creative Commons BY-NC-SA 4.0 license.