Code
library(ggplot2)
ggplot(data=iris, aes(x = Sepal.Length, y = Sepal.Width)) +
 geom_point(aes(color=Species, shape=Species)) +
 xlab("Sepal Length") +
 ylab("Sepal Width")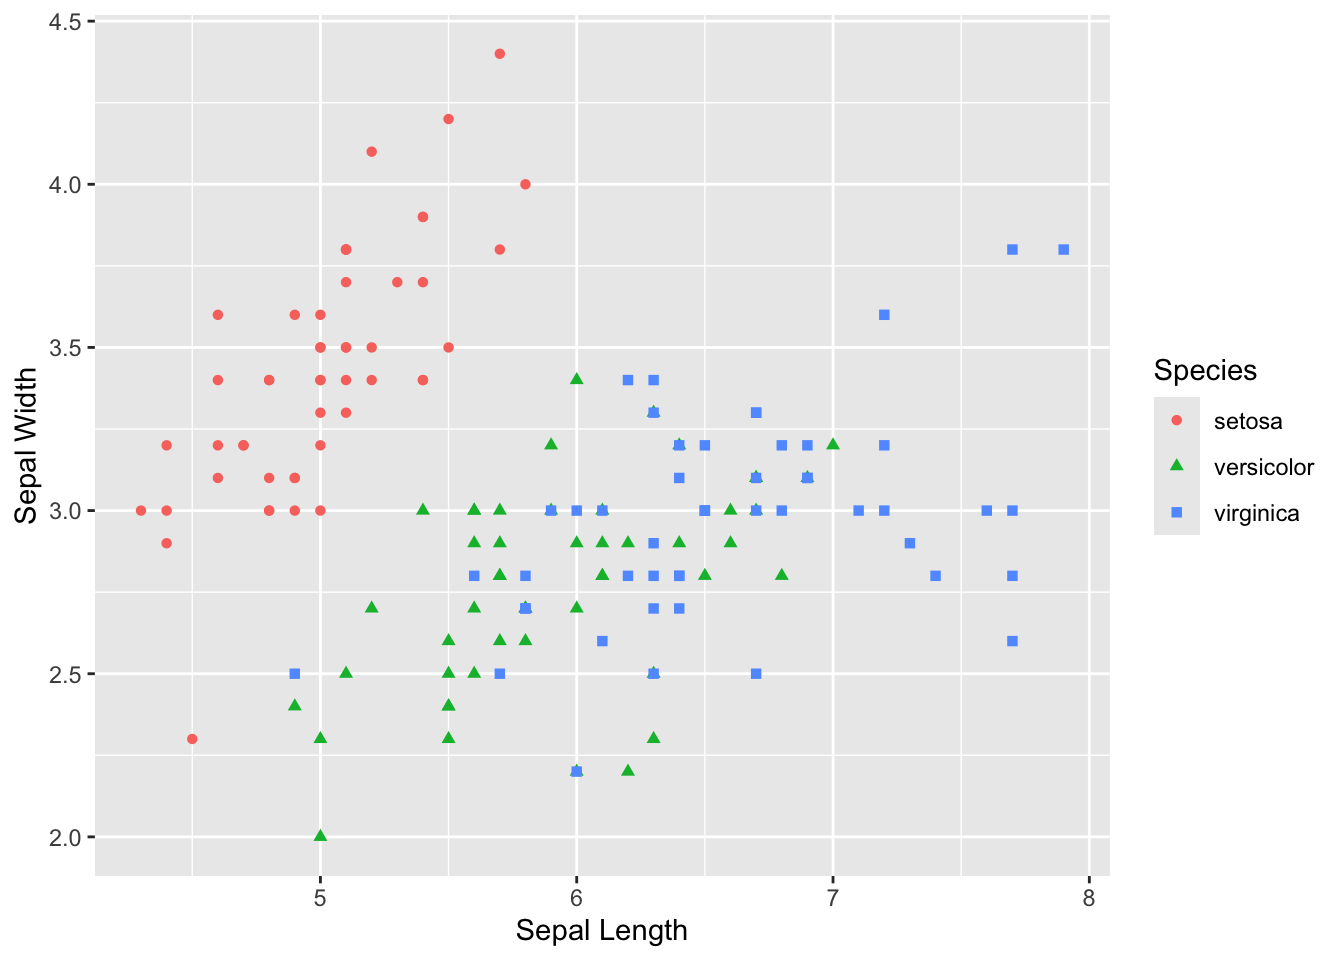
The first chapter of these notes, on linear regression, was written and maintained by Stijn Vansteelandt and Lieven Clement of Ghent University, and by Arnout Van Messem of GUGC. It was converted to Quarto for the purpose of being included in this book. All other chapters were written from scratch to support the course of Introduction to Statistical Modeling at GUGC.
Most of the figures in this book are generated with R. If you are reading this book online, you can view the source code for each figure by clicking the little triangle next to the word “Code” above the figure. In the PDF version of this book the code is listed inline with the figure.
library(ggplot2)
ggplot(data=iris, aes(x = Sepal.Length, y = Sepal.Width)) +
geom_point(aes(color=Species, shape=Species)) +
xlab("Sepal Length") +
ylab("Sepal Width")These course notes are made available under the Creative Commons BY-NC-SA 4.0 license.